Social distancing in Australia during the COVID-19 pandemic
This page shows results using colocation data from the Facebook Data for Good project to quantify and map social distancing in Australia during the COVID-19 pandemic. We use the colocation data to derive estimates for the average number of contacts per person in a given region with people in another region. Baselines for percentage change maps are calculated as the mean of the first three weeks of the metric plotted.
Maps
External-region contacts only
Internal + external-region contacts
Mixing proportion
This shows the proportion of all contacts that are taking place with external regions, relative to all regions (internal + external). Lower values indicate a greater propensity for people to "stay home".
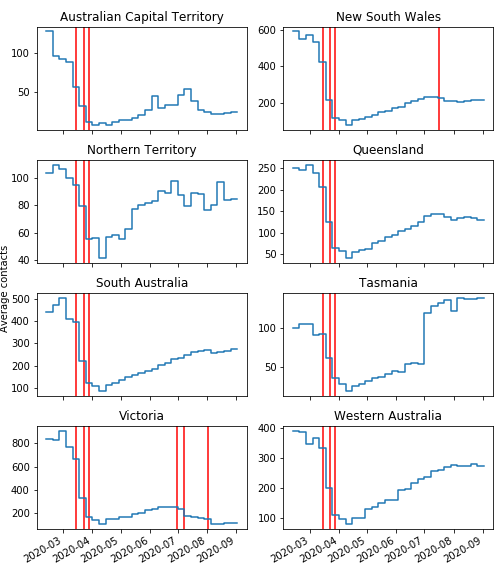
The figure below shows the results at state level, using external contacts only.